Debug Logs
Debug Logs tool helps you list, bulk delete, enable/disable tracking, open, analyze, tail, save, and re-open Salesforce Apex debug logs all in one place.
To open the tool, click on Modules Menu -> Debug Logs. If you access this tab often, you can add it as default tab so
it will be loaded automatically next time in Preferences
Overview
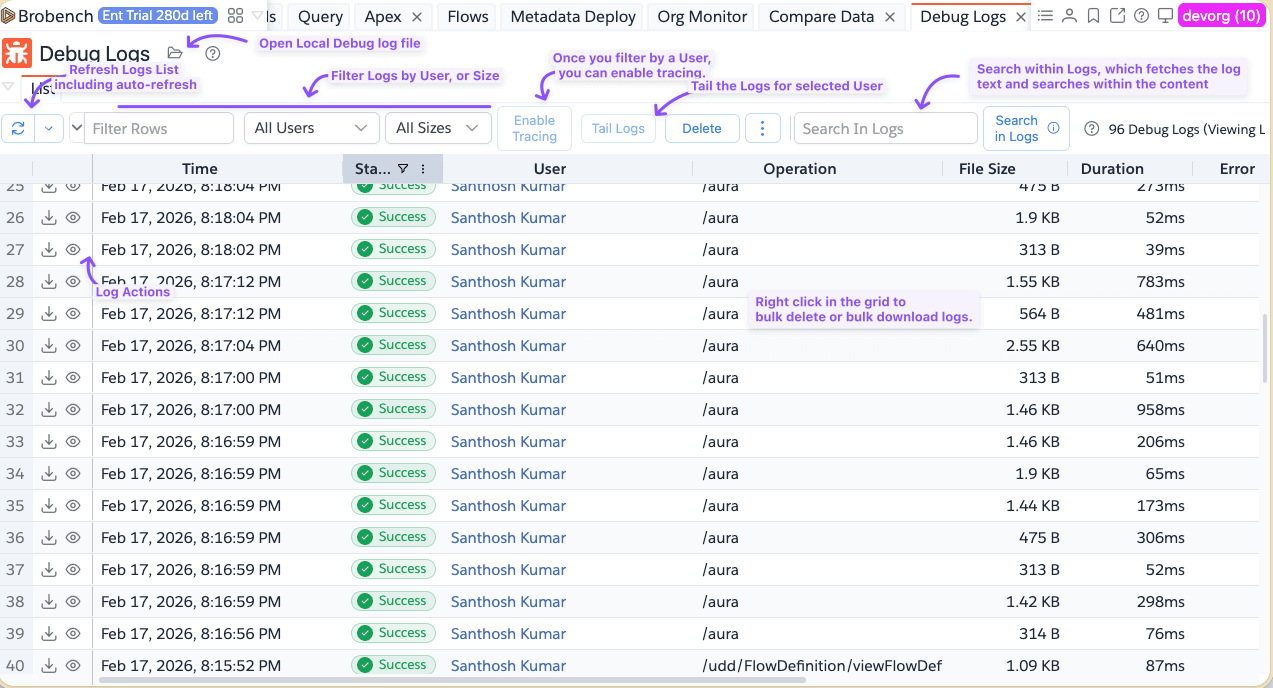
When you open the log, it shows the following screen. By default, it shows all available logs and allows you filter by Log Size and by Users.
You can double-click on any of the log in the list to open the log details. Check out the following sections which walks through various aspects of managing logs.
Enabling Tracing
To enable logs, first you need to select a user.
There are two ways to select a user. Check if the user is shown in the
Users filter. It will show all users for which there are any logs, current user or any user you have previously
selected. Select any user from the list and then click on the Enable Tracing button and follow the prompt.
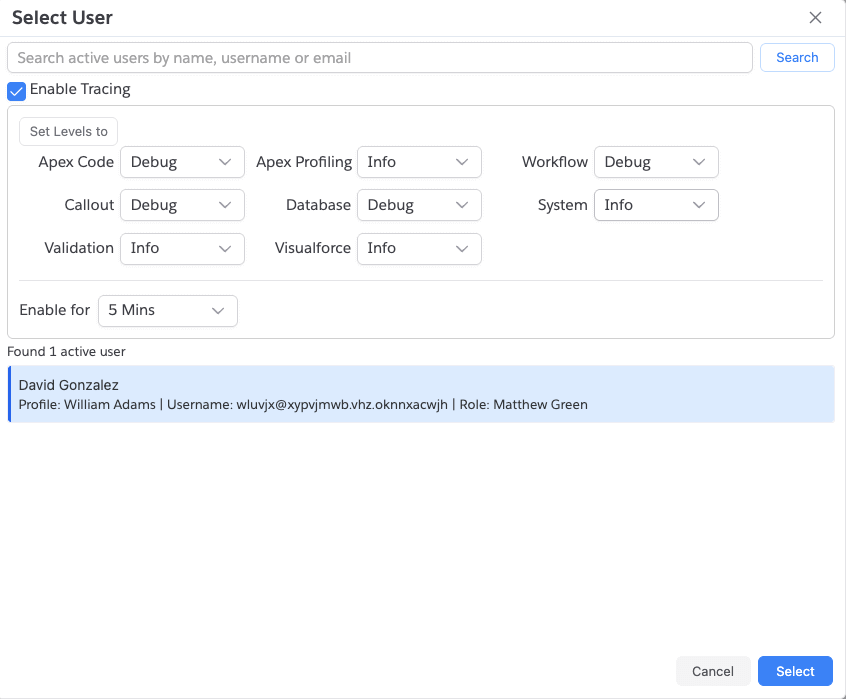
If the user you looking for is not shown, click the Select User... menu item. It will show following dialog. Select
the user and check the flag "Enable Logs"
Disable Tracing
To disable for current user, click on the Disable Tracing button which should disable the tracing. To disable tracing
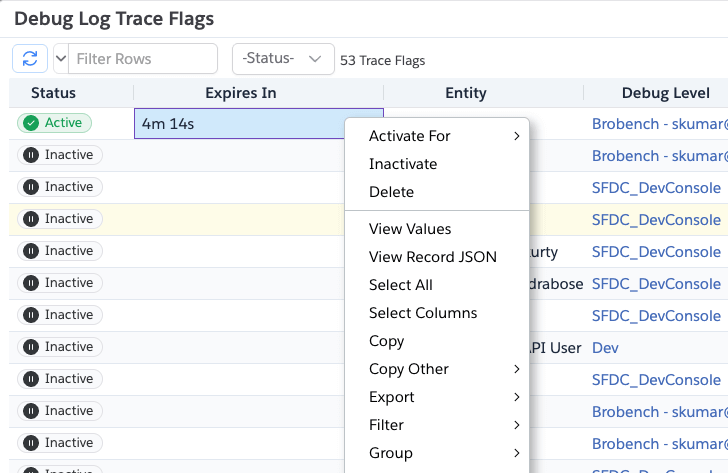
for one or more users, click on the More Actions menu and select Manage Trace Flags.

App will show below dialog with all available trace flags. Select one or more users, right-click and select the actions either to extend the tracing, inactivate it or delete it all together. You can select multiple users if you want to manage in bulk.
Filter Logs
There are a couple of ways to filter logs.
- Select a User from the
Usersdropdown - Select log size to show only logs above that size. This is helpful as many times Salesforce generates logs with just a single line which just clutters the list.
Filter by Searching in Logs
Filtering by User or Size, just checks the log record but doesn't look inside the log content. If you want to show only
logs contains certain text in the log content, then enter the search term in the Search In Logs and click on
Search in Logs button. App will download all the logs and then shows only the logs containing that keyword. Match is
when content contains entered keyword case-insensitively.
Opening Logs
There are multiple ways to open the log file.
- Just double-click on the row
- Or Click on the
Eyeicon on the corresponding row-actions. - Or Right click and select
Open Log Analysis - Or If you have a local log, what you want to analyze it, click on the
Openicon in the header
All of those actions will open the log in new tab. See Analyze Log about analyzing the log file.
Deleting Logs
If you want to delete all logs, click on the Delete button and select Delete All Org Logs which will prompt you and
then deletes all logs from the log.
If you have selected a user, you can delete all logs for selected using by selecting Delete All <User>'s Logs.
To delete specific logs, select one or more logs from the list and select Delete Selected Logs
Download Logs
To download logs:
- Click on the
Downloadicon in the list row actions (next toEyeicon). That will download just that log. - Or right-click and select
Download Logswhich will download all selected logs
The Debug Logs documentation is organized into these task-focused pages:
Tail Logs
Are you a fan of tail -f app.log command? Well Tail Logs is exactly that. When you click on the Tail Logs button, it
will start tailing the logs for current user. No need to enable tracing or disabling. All happens automatically.
See Tail Logs for more info.
Save Logs
Sometimes you may want to save a log or two so you can analyze later. Instead of you having to download and keep it
somewhere, you can make use of Save Logs feature. See Save Logs for more info.