ER Diagrams
The ER Diagrams module allows you to build, visualize, and interact with Entity-Relationship diagrams corresponding to your Salesforce objects metadata directly inside Brobench.
Purpose of this tool is to help you understand your Data Model in industry standard diagram and make it easy for you to build that based on the Org Object Metadata.
To access this, click on the Modules Menu -> ER Diagrams. Note that if you access this
module often, you can add this to your Main Layout in Settings/Preferences
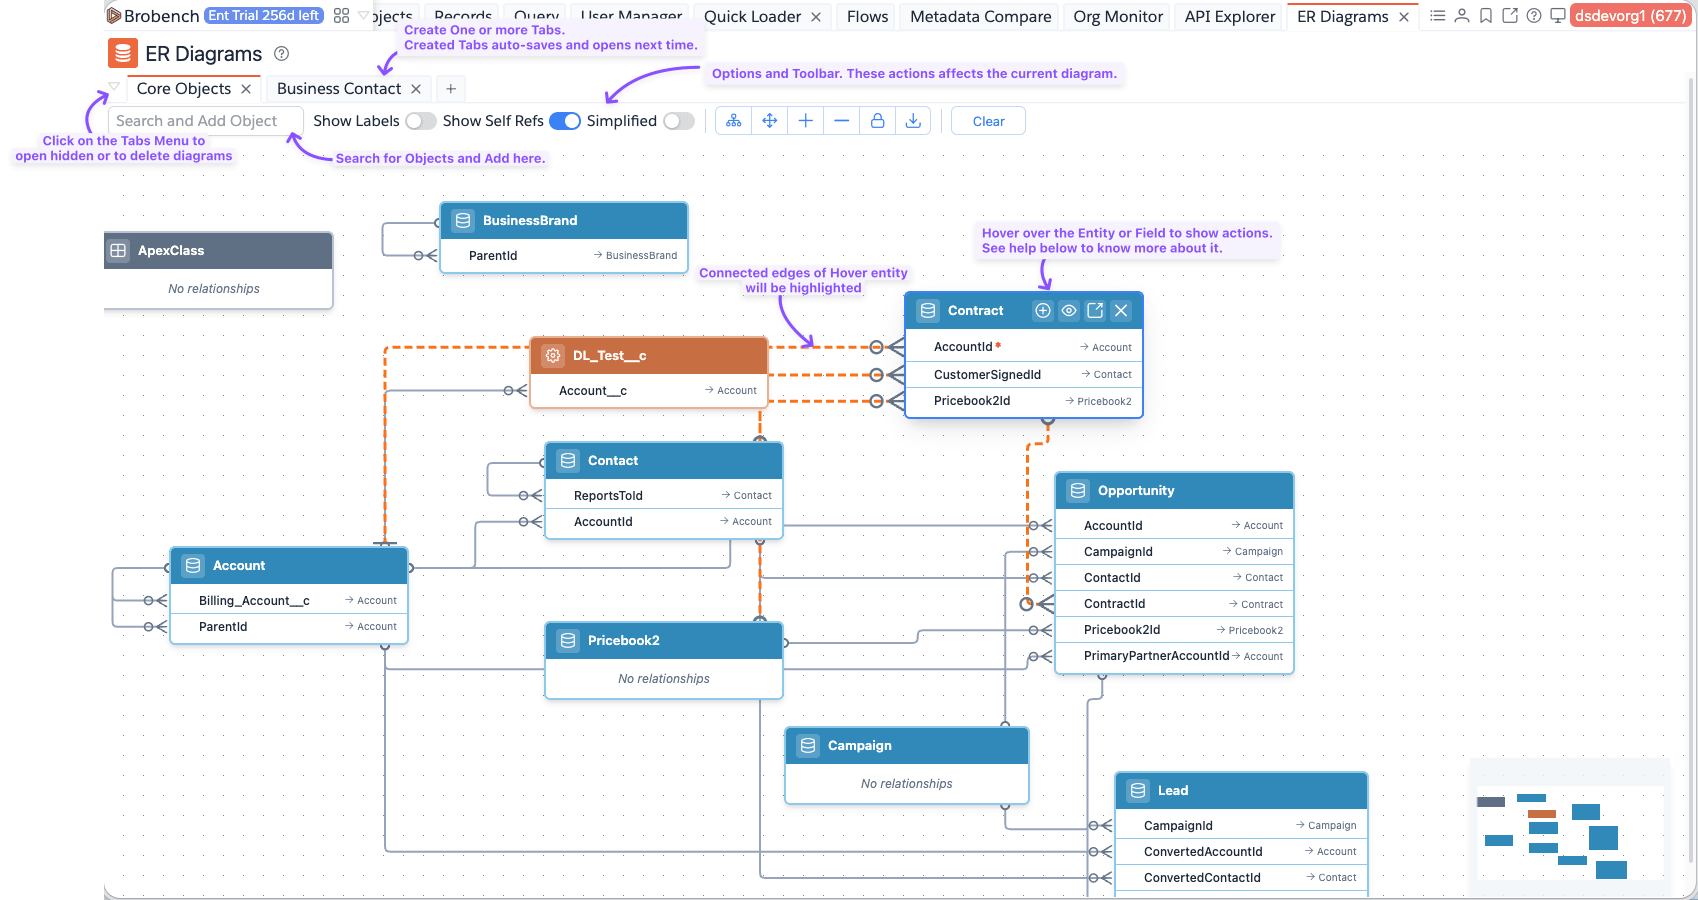
Here is how the ER Diagrams module looks like.
Creating Diagrams
When you load the ER Diagrams module for the first time, or if you don't have any existing diagrams, you will see an
empty state message. Click on the Create New Diagram to create one. If you had already opened a diagram, it will be
opened by default.
If you want to create a new Diagram, click on the + Icon on the tab-strip or click on the Tab Menu and select
New Diagram.

Managing Diagram
Adding Objects
When you create a Diagram, it will be blank. You can search for Objects in the Search and Add Objects input.
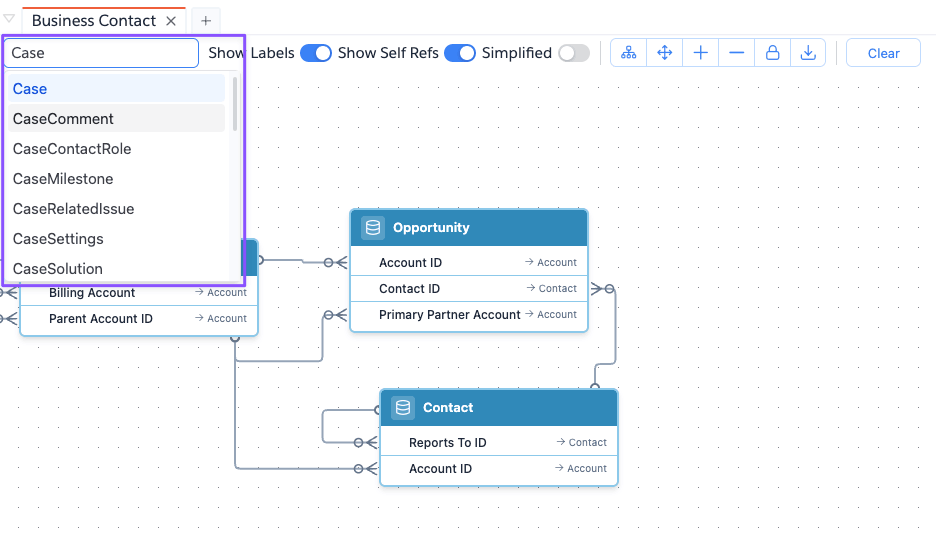
When Objects are added,
- They will be placed in the canvas using Auto-layout.
- You can move around the entities. To move around, click on the entity title and drag around.
- The connections between entities in the canvas will be added automatically.
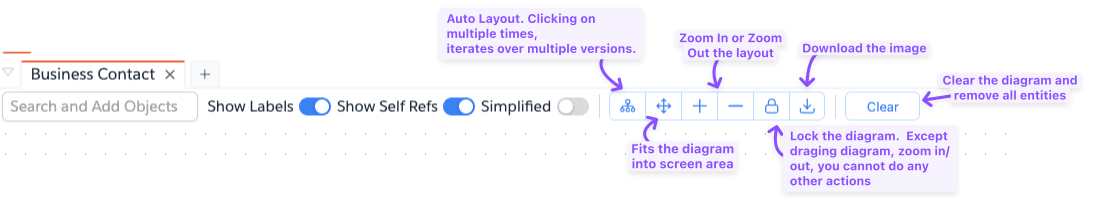
Actions and Toolbar
Diagram has some actions to help you Zoom, drag the diagram or to lock it to prevent any accidental changes. See the list of actions below.
Controlling Visibility
ER Diagrams might become extremely dense depending on your Org schema. Use the available Top Toolbar toggles to narrow down the noise:
- Show Labels: Toggles visibility of relationship mapping names overlaying the edges.
- Show Self Refs: Disables or enables recursive lookups (e.g., Account ParentId pointing to Account), cleaning up looping arrows.
- Simplified: Minimizes object node sizes, omitting long field lists to leave more canvas room for high-level structure visualization.
Canvas Manipulation
- Auto Layout: Automatically readjusts floating elements into a structured view using advanced layout routines to avoid clashing paths.
- Fit View: Center and align your perspective as the diagram grows.
- Zoom In / Zoom Out: Fine-tune the visualization scale.
- Lock/Unlock Diagram: Prevents accidental repositioning of elements via your mouse.
- Export as PNG: Takes a snapshot of your canvas and exports it directly to an image asset for presentations or documentation purposes.
- Clear: Removes all currently rendered objects to provide a pristine canvas. (Note: This does not delete your saved diagram wrapper, just its canvas items).
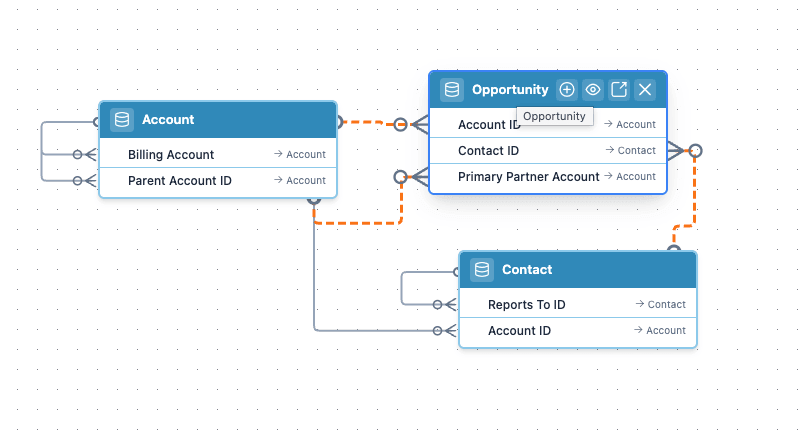
Hover over Object/Field/Edge
You can hover over any Object or Field or Edge and app will either show an animations of related edges/objects or show a popup with info.
Hover over Object
Hover over Field
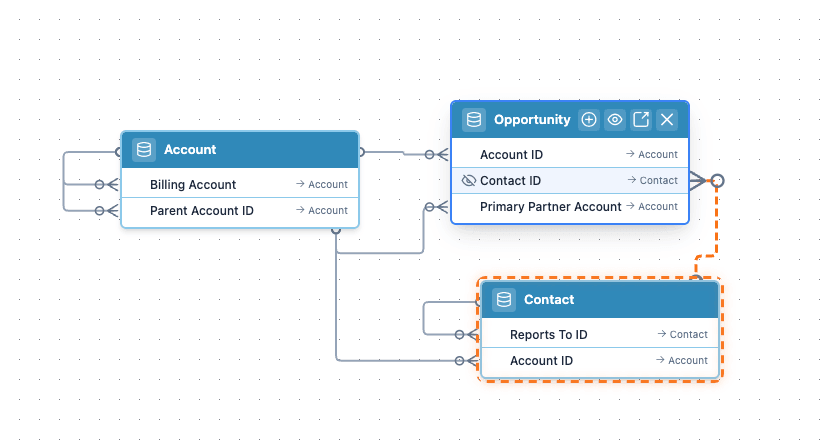
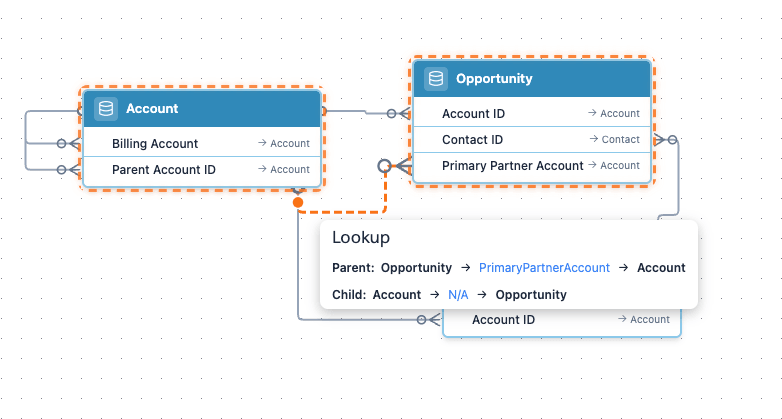
Hover over Edge
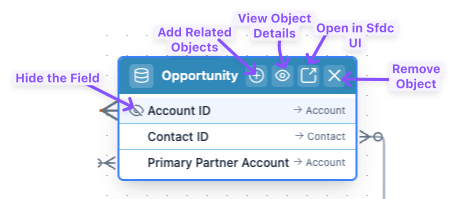
Object Actions
When hover over an Object, it shows some actions.
Multiple Diagram Tabs
Brobench allows you to work with multiple diagrams efficiently using the powerful tab system. You can maintain multiple concurrent diagrams open in the workspace and swiftly switch between distinct functional domains (e.g., Sales schema vs Support ticket schema).
Tab Actions
Right-clicking any open diagram tab reveals multiple context actions to manage your view:
- Rename Diagram: Update the diagram's name.
- Delete Diagram: Permanently delete the diagram and its contents from the workspace.
- Pin Tab: Keep important tabs pinned to the start of the tab bar.

Manage Diagrams
To view all the diagrams you have previously created (both active and closed tabs), click the tabs dropdown icon /
Manage Diagrams button on the left side of the tab bar.
The Manage Diagrams dialog displays all stored diagrams, allowing you to open them, rename them, or delete them from the registry altogether.
