Field Analysis
Field Analysis module deals with understanding of how many Objects/Fields have data populated and metrics around that population. Having these metrics on hand is crucial in Org Maintenance, Data Migration and other Data cleanup activities.
Here are some noteworthy features of this module.
- Create one or more analysis requests so you can re-analyze later
- Analyze one or more objects in the same request
- Ability to analyze all or specific set of fields. This is critical if you want to analyze a huge number of records so you can limit to a specific set of fields.
- Ability to deep-analyze Picklist/Multi-picklist values and Record Types to get value level metrics
- Gather Population by Record Types, field level metrics as well as data-type-specific metrics
- Render results in color-coded grid for easy identification fields by population group
- Export all of this data into a CSV Zip File, Excel file, or Google sheet for easy reference and sharing
Overview
The Field Analysis screen consists of five panels of information laid out in an easily understandable way. The following screenshot highlights all of those panels and other bits of information. You can resize the panels to make more room for the information you’re viewing.
You can open this module from App Menu -> Modules -> Field Analysis
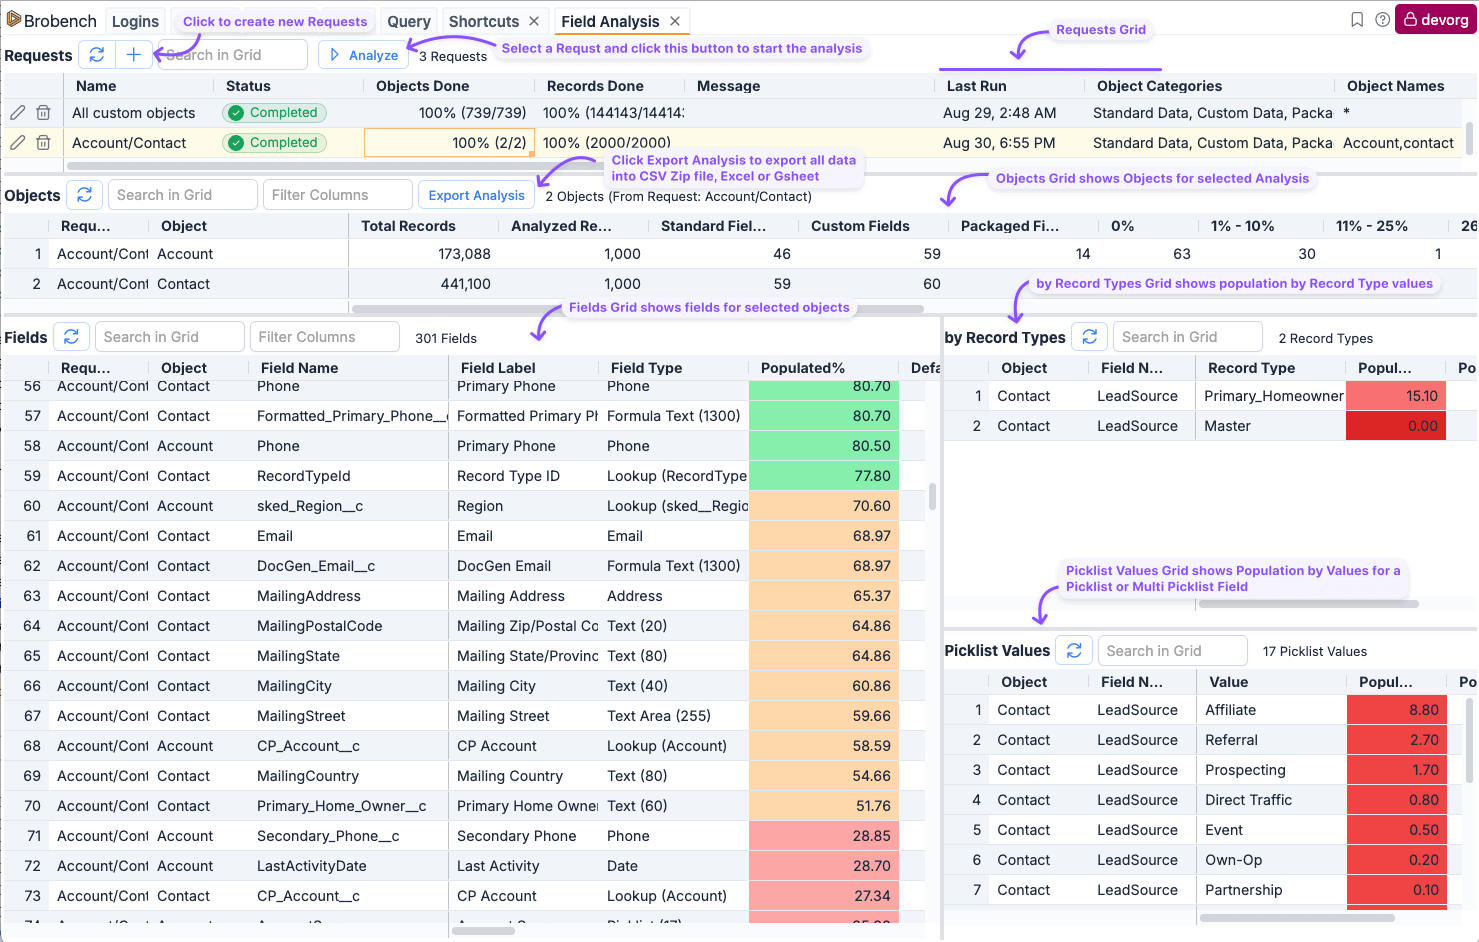
| Panel | Description |
|---|---|
| Requests | This panel shows all requests that are applicable for current connection. You can add, edit and delete Requests. Once you are ready to start the analysis, click on the Analyze button |
| Objects | This panel shows Object level information for selected one or more requests. |
| Fields | This is the main result panel which shows details of field usage. When you select a request, it will show all fields in that analysis. However you can also show fields for one or more objects, by selecting those objects in the Objects panel. |
| By Record Types | This panel shows the details of field population by Record Type, if there are any record types in that object. |
| Picklist Values | This panel shows the Picklist Value population for selected Picklist or Multi Picklist fields. If you select non-picklist fields, then this grid will be empty. |
Usage
Here is the typical usage of this module.
- Have a plan which objects you want to analyze and how many records you want to analyze
- Create a Request to specify that design
- Select that request in
Requestsgrid and click onAnalyze - App should start the analysis. Click on the request again to refresh the Objects and other panels with that Request run details.
- Explore the results
- Export the Results. You can explore individual panel grid using
standard Grid Export controls or you can click on
Export Analysisto export complete analysis details into CSV Zip file, Excel or Google Sheet.
Request Dialog
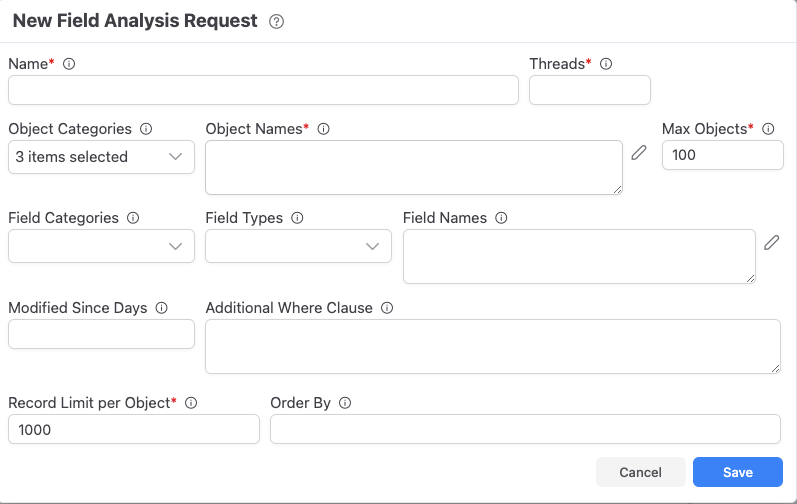
When you want to add (click on Plus icon) or edit (click on Pencil icon) a request, the following dialog is shown.
| Field | Type | Description |
|---|---|---|
| Name* | Text | Enter any meaningful name for this request |
| API Type | Batch/Bulk | If you are analyzing more than 10-15k records, you can choosing Bulk API type should help complete the analysis faster. Bulk API has some quirks so check out the Bulk API for more info. |
| Threads | Integer (Defaults to 5) | Indicates how many objects are analyzed in parallel. |
| Object Categories | Picklist | Select the object categories which acts as first level filter to select Objects for analysis |
| Object Names | Text | Enter the comma separated values of Object Names that should be analyzed. This filter is applied after Object categories. This field supports wild cards. For ex., you can enter *Account* to analyze all objects containing Account word in them. To match all objects in selected categories, enter * |
| Max Objects | Number (Default to 100) | Since Field Analysis can query lot of data, we ask you to specify how many objects you are expecting the Object Categories and Object Names to match. If we find that it matched more objects than this, it will error out. This is for your safety. Defaults to 100. |
| Field Categories | Picklist | Select the list of Field Categories that should be used to match fields. |
| Field Types | Picklist | Select the list of Field Types that should be used to match fields. |
| Field Names | Text | Enter the field names that should be used to match fields. This field supports wild card matching. For ex., sked__* will match all fields from skedulo package. Note that fields are first matched by Field Category, and then by Field Type and then by Field Names. If this is blank, then all fields are considered matched. |
| Modified Since Days | Integer | This is a shortcut to specify a where clause CreatedDate >= days or SystemModstamp >= days |
| Additional Where Clause | Text | You can specify any additional where clause that should be applied to match records. Note that if you are analyzing multiple objects, this where clause must be valid for all of them. Typically you would use this to match by system fields or by Record Type. |
| Order By | Text | Specify any Order by that should be used while querying records |
| Record Limit per Object | Integer (Defaults to 1000) | Number of records to fetch per Object. |
Objects Grid
Objects Grid shows the list of Objects from selected request in Requests grid. If you select more than one, then all Objects in those Requests are shown.
Here are the various columns in this datagrid and what they mean.
| Column | Description |
|---|---|
| Request | Shows the Request for which this Object was analyzed. This column is added so that you can identify which request matched an object when Objects from multiple requests are shown. |
| Object | Object API Name |
| Total Records | Total Number of records in the object. Note that for big objects, this is an estimation and not exact count. |
| Analyzed Records | Number of records queried for the analysis |
| Standard Fields | Number of standard fields in the Object. |
| Custom Fields | Number of custom fields in the Object. This should give you an idea how heavily this Object is customized |
| Packaged Fields | Number of packaged fields in the Object |
| Various % Fields | These fields tell you how many fields in that Object fall into this bucket of population. This should give an idea at a high level how Object customizations are used. |
| Various Record Dates | This is a roll-up metric from the corresponding Field level metric field. See Fields Grid for more info on each of these fields. |
Fields Grid
Here are the various columns in the Fields data grid and what they mean.
| Column | Description |
|---|---|
| Request | Name of the FDA request, where this field was analyzed. This is there because you can show fields from multiple requests at the same time |
| Object | SObject of the field |
| Field Name | Field API Name of the field |
| Field Label | Field Label of the field |
| Field Type | Detailed Field Type information |
| Populated% | % of records where there is a non-null or non-false value. This is the percentage of Populated Count/Analyzed Count |
| Default% | % of records where value is populated but that populated value is default value for that field. This metric tells you that field is created but never really populated beyond default value. |
| Populated Count | Number of records where there is a non-null or non-false value |
| Analyzed Count | Total number of records analyzed. This count will be same for all fields in a request |
| First Record Created Date | This is the earliest CreatedDate of a record where this value is populated |
| Last Record Created Date | This is the latest CreatedDate of a record where this value is populated |
| First Record Modified Date | This is the earliest ModifiedDate of a record where this value is populated |
| Last Record Modified Date | This is the latest ModifiedDate of a record where this value is populated |
| Min String Length | Minimum value of string.length of all values in this field. This is populated for all fields which are not, dates/booleans/numbers. |
| Max String Length | Maximum value of string.length of all values in this field. This is populated for all fields which are not, dates/booleans/numbers. |
| Min Number Value | Minimum number value of all values of this field. This is populated for number/percentage/currency fields. |
| Max Number Value | Maximum number value of all values of this field. This is populated for number/percentage/currency fields. |
| Earliest Date | Earliest date/time value of all values of this field. This is populated for date/datetime/time fields. |
| Latest Date | Latest date/time value of all values of this field. This is populated for date/datetime/time fields. |
| True Count | Number of records with True values in this field. This is populated for boolean fields. |
| False Count | Number of records with False values in this field. This is populated for boolean fields. |
| Field Created By | This is metadata value of who created this field in the system. This is populated only for custom fields. |
| Field Created Date | This is metadata value of when this field was created in the system. This is populated only for custom fields. This can help you understand if this was created recently and back-populated for earlier records. |
| Field Modified By | This is metadata value of who last modified this field in the system. This is populated only for custom fields. |
| Field Modified Date | This is metadata value of when this field was last modified in the system. This is populated only for custom fields. |
By Record Type Grid
If Object makes use of record types, it is possible that a field is applicable only for one or more Record Types. So low population doesn't necessarily mean that field is not used. Viewing By Record Type population can tell you for which record types the values are populated.
| Column | Description |
|---|---|
| Object | SObject of the field |
| Field Name | Field API Name of the field |
| Record Type | Record type name |
| Populated% | % of records where this value is populated |
| Populated Count | Number of records where this value is populated. |
By Picklist Value Grid
Here are the various columns in the Values data grid and what they mean.
| Column | Description |
|---|---|
| Object | SObject of the field |
| Field Name | Field API Name of the field |
| Value | Picklist value |
| Populated% | % of records where this value is populated |
| Populated Count | Number of records where this value is populated. Note that for Multi-picklist fields, each value is analyzed independently so Populated Count could be more than number of records where this field is populated. |
Bulk API
Field Analysis now supports data querying through the Bulk API, enabling faster analysis of a large number of records.
If you're analyzing more than 10,000–15,000 records in an object, you can choose the Bulk API option, which uses Bulk V2 Query to read records efficiently.
- Execution Time: Bulk queries may take some time to process. Records will only be analyzed after the query completes—so please be patient.
- Daily Quota Limits: Each org has a daily limit on the number of bulk batches. Make sure to check your Bulk API quota before using this feature to ensure you have enough capacity.
- Avoid Using
ORDER BY/LIMIT: Bulk queries perform better when noORDER BY/LIMITclause is used. Instead, ensure yourWHEREcondition is precise and filters the data appropriately. - Learn More: Refer to the Bulk V2 Query documentation for more details.