Analyze Log
When you open any log from Manage Logs (or a local log), Brobench opens a log analysis tab with multiple views.
Overview
Here is how a typical log analysis page looks like. It has a header with some basic info, including any erros from the log and various tab that shows the log in a different view.
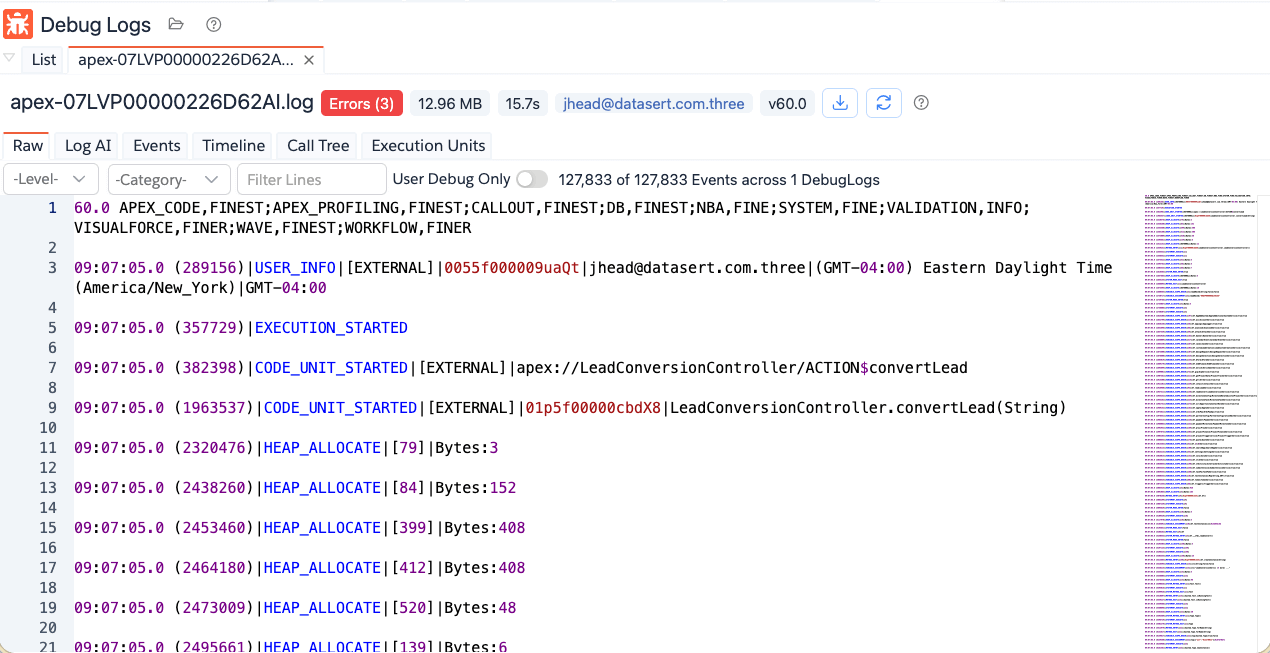
Raw Tab
Raw shows log lines in editor format with fast filtering controls. Click on the User Debug Only to show only the
User Debug and any exception events.
You can also filter by other means as follows.
- Filter by event level: This will show only the events that are at or higher than selected level. For example, if
you select
Info, it will show Info, Warning, Error and Fatal levels. - Filter by event categories: It shows the events matching selected event category.
- Text filter across lines: This will all events containing the search term
- Toggle User Debug Only: to focus on debug statements.
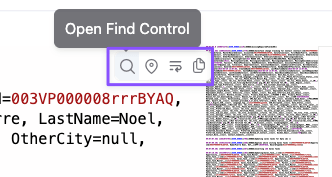
If you want to search in the log you can do Ctrl/Cmd + F or click on the Find icon that is shown when you hover over
the editor.
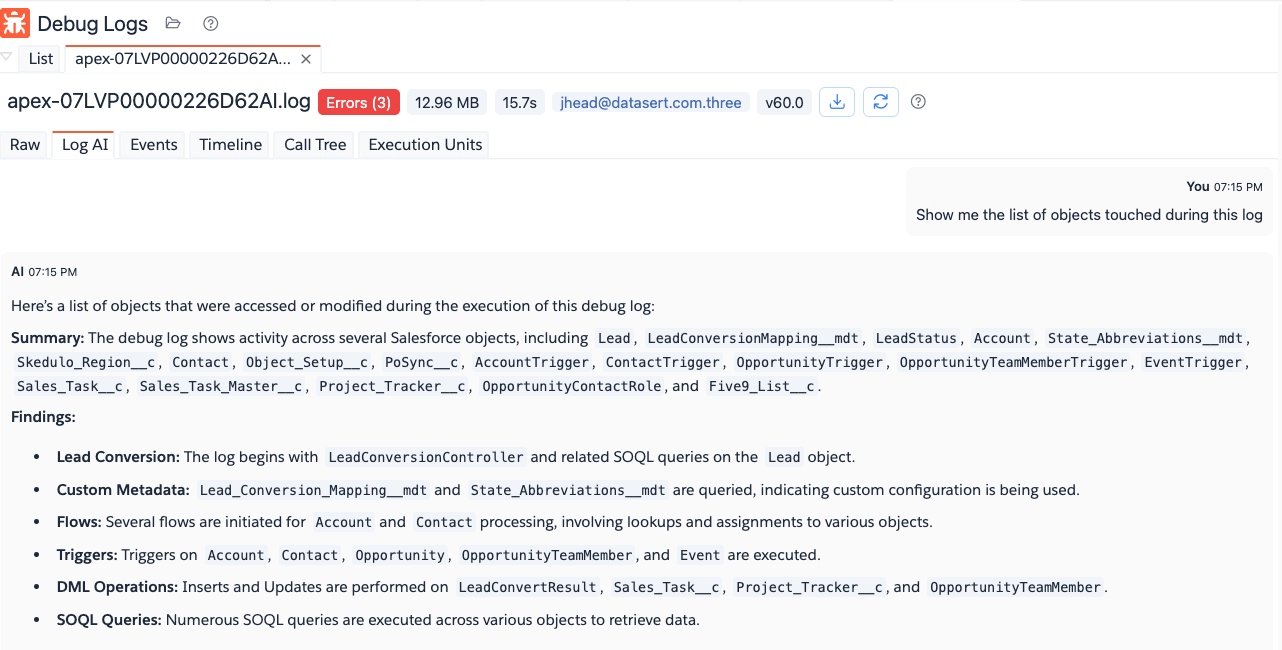
Log AI Tab
Log AI opens an AI chat with debug-log context preloaded from the parsed log.
- Sends compact context built from parsed log entries.
- Starts with a default prompt to summarize bottlenecks/errors/SOQL/DML behavior.
- Keeps a running chat in the current analyzer tab.
Enter a prompt asking something about the log.
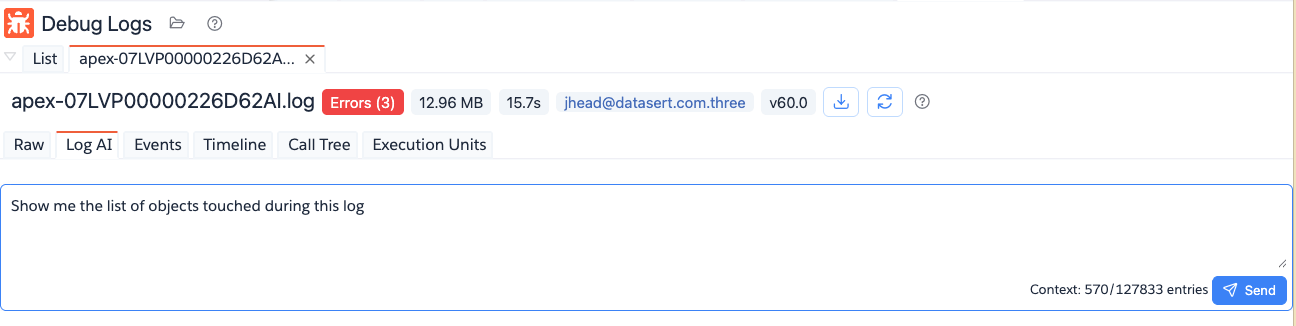
Brobench will use one of the SOTA models to answer your question. See AI Features for more info about the AI usage
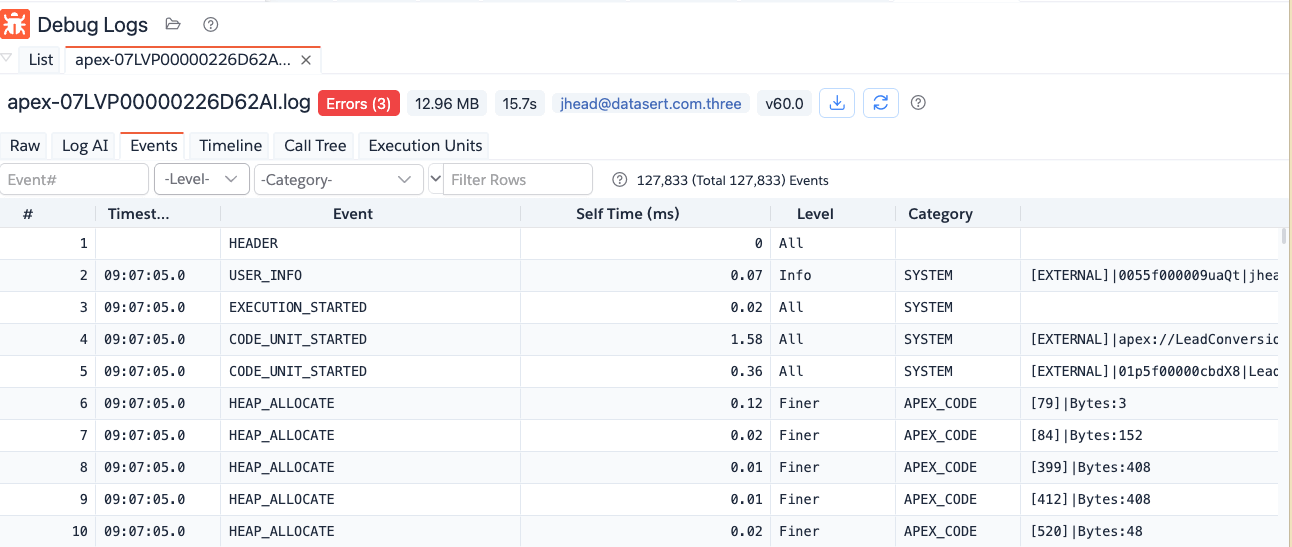
Events Tab
Log Events presents parsed log events in a datagrid for precise filtering and navigation.
- Event number search (
Event#). - Level filter (
ErrorthroughFinest). - Category multi-select filter.
- Columns for timestamp, event type, self time, level/category, and event info.
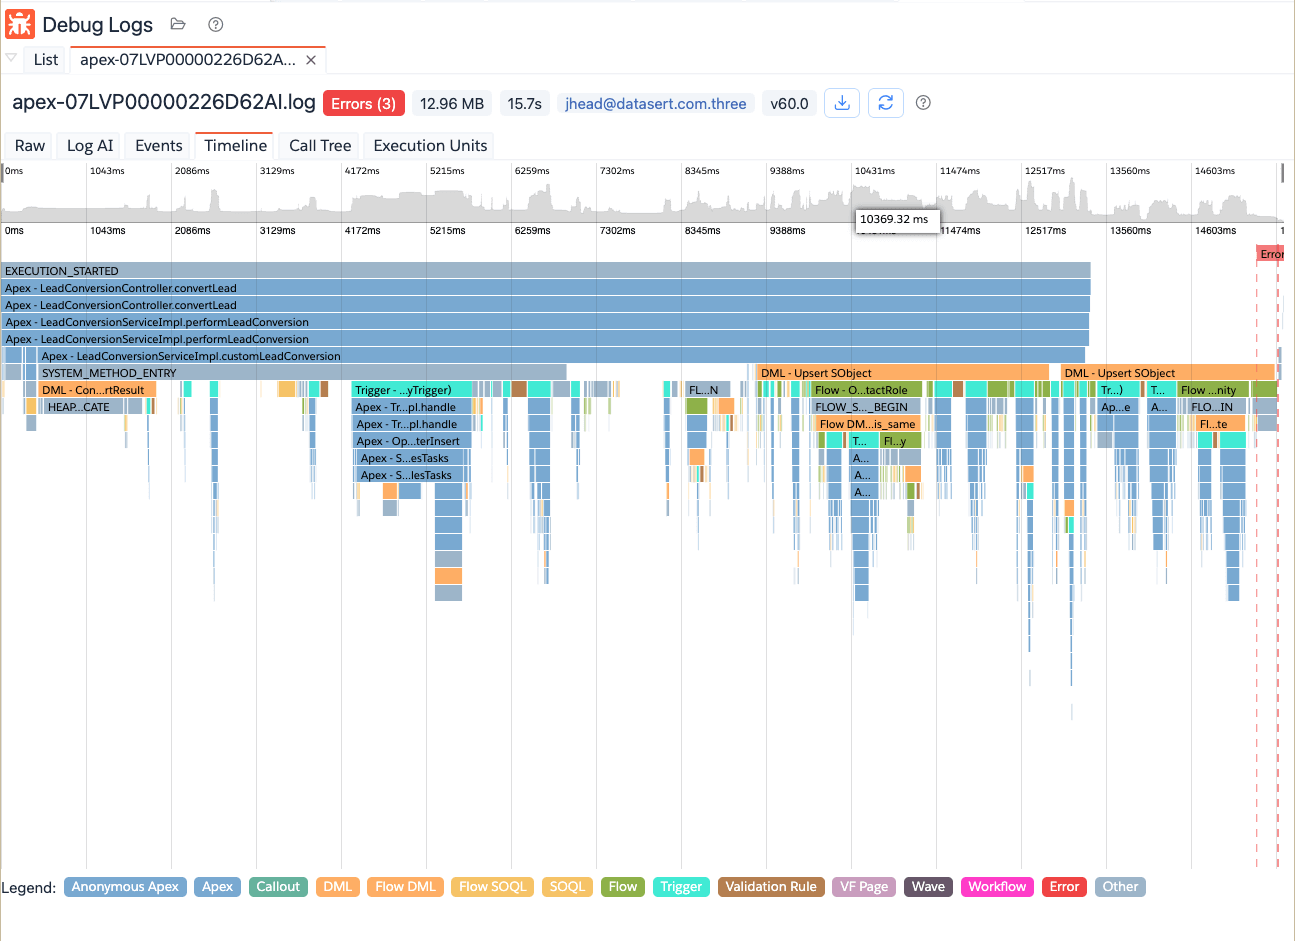
Timeline Tab
Log Timeline renders execution timing as a flame chart for visual performance analysis.
- Flame graph by execution duration.
- Color legend by unit/event type.
- Error marks on timeline.
- Tooltip with total/self time, SOQL count, DML count, and event reference.
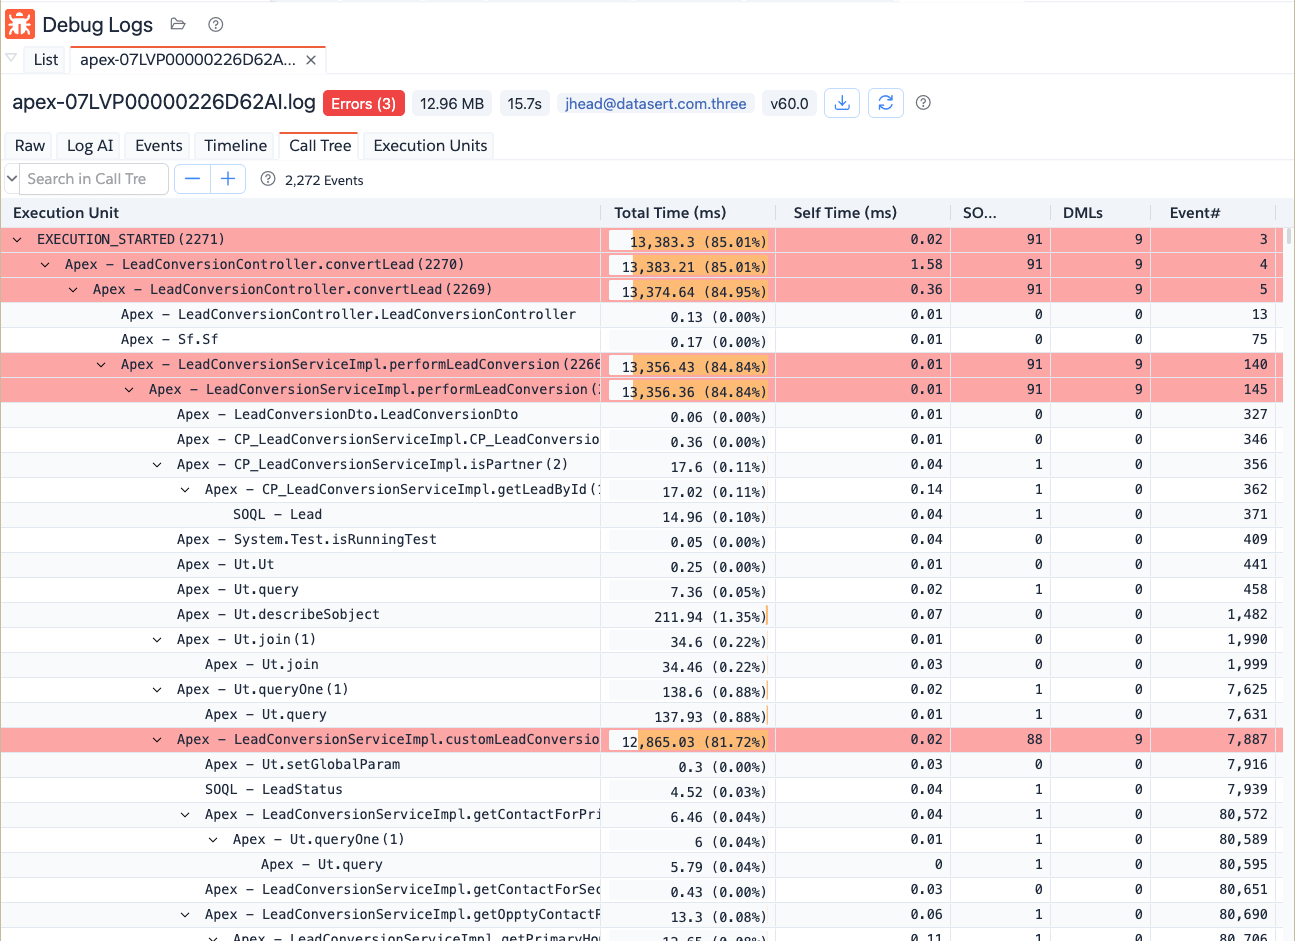
Call Tree Tab
Log Call Tree shows hierarchical execution units and timings derived from the parsed log.
- Tree view of nested execution paths.
- Total time and self time metrics.
- SOQL/DML counts per node.
- Expand/collapse all controls.
- Search in call tree.
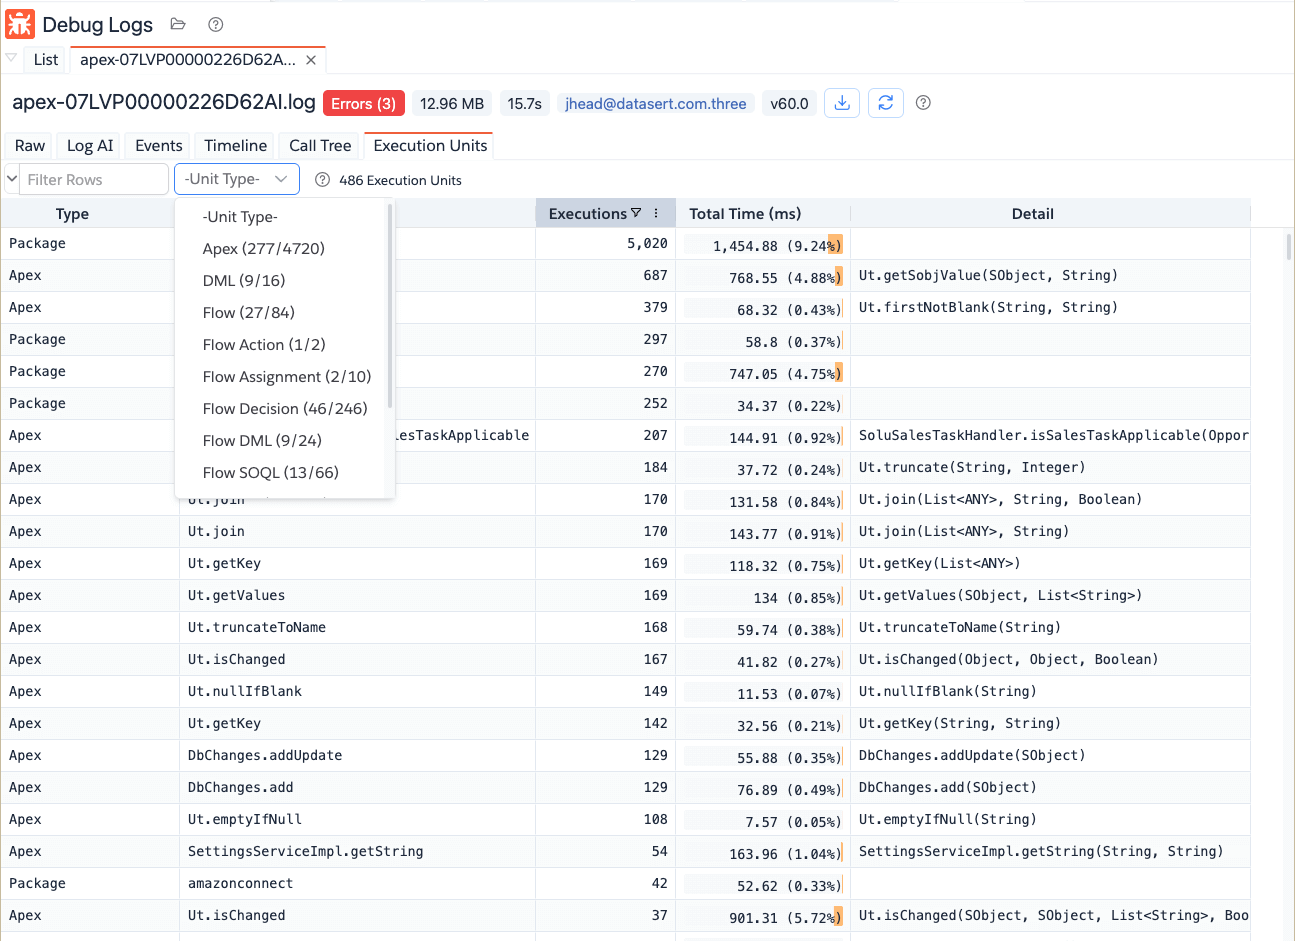
Execution Units Tab
Log Execution Units aggregates repeated units to help identify expensive patterns.
- Grouped by unit type/name/detail.
- Execution count.
- Total time with percentage.
- Unit-type quick filter.