Highlighting
The Highlighting feature in Brobench datagrids lets you visually emphasize specific rows and cells with various colors to improve data analysis and visibility. It helps you quickly identify patterns, track changes, and focus on important data points.
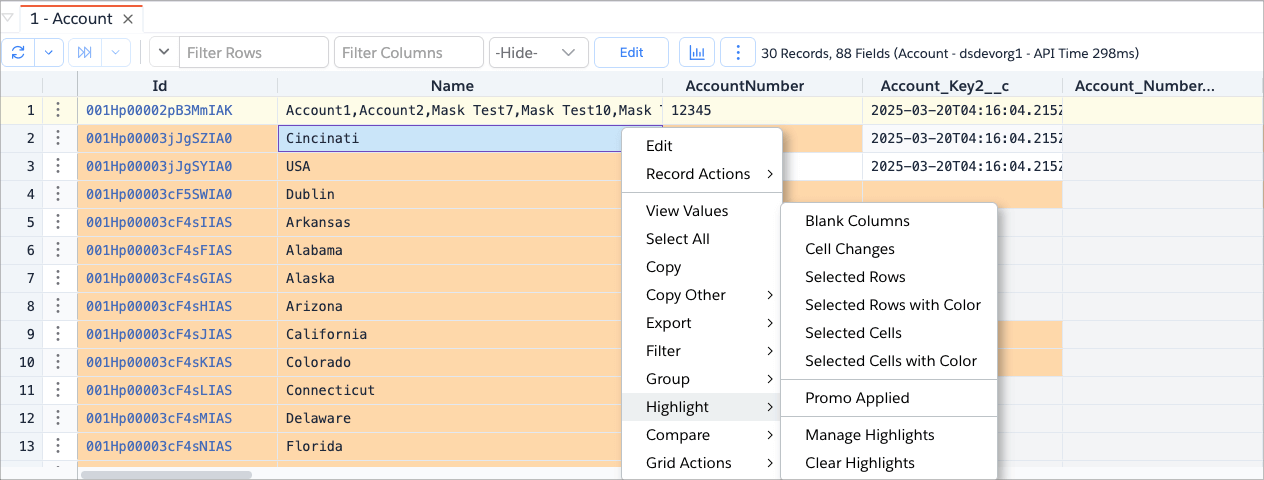
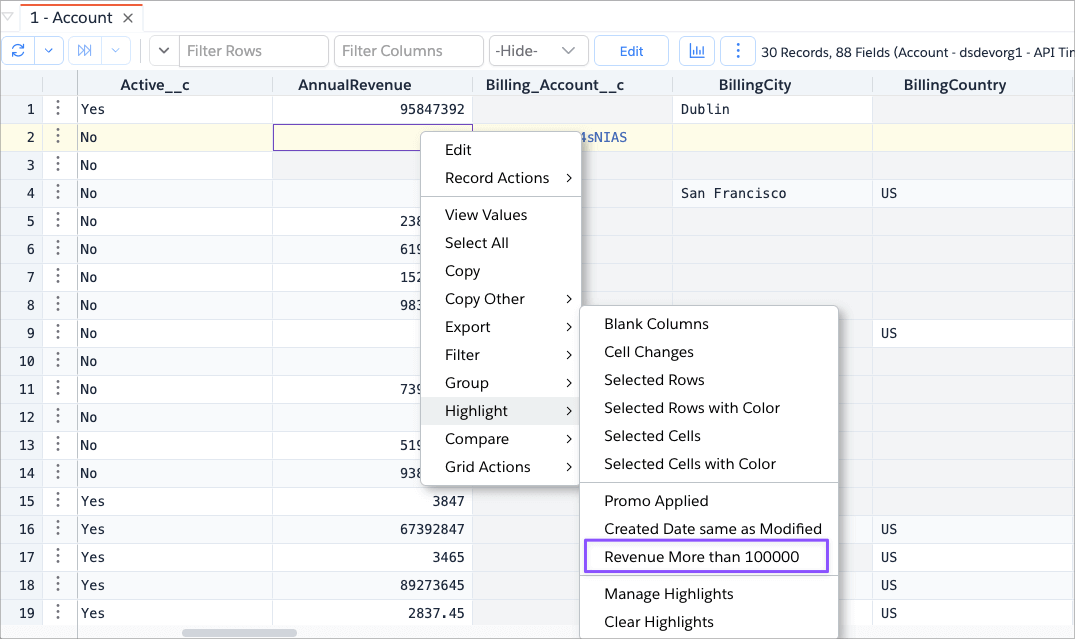
You can access the highlighting options by right-clicking on the datagrid and selecting an option from the Highlight menu group.
Built-in Highlighting Options
The app comes with several built-in highlighting options that can be toggled on or off.
Blank Columns
Highlights all columns where all rows contain empty or null values for that field.
- Even a single non-empty value in any of the rows in that column will not trigger the highlight.
- This considers only the rows that have been fetched into the datagrid. For example, if your query matched 10,000 records, but you’ve fetched only the first 2,000 records, then the highlight will be based on those 2,000 records only. As you fetch more, the highlight may change.
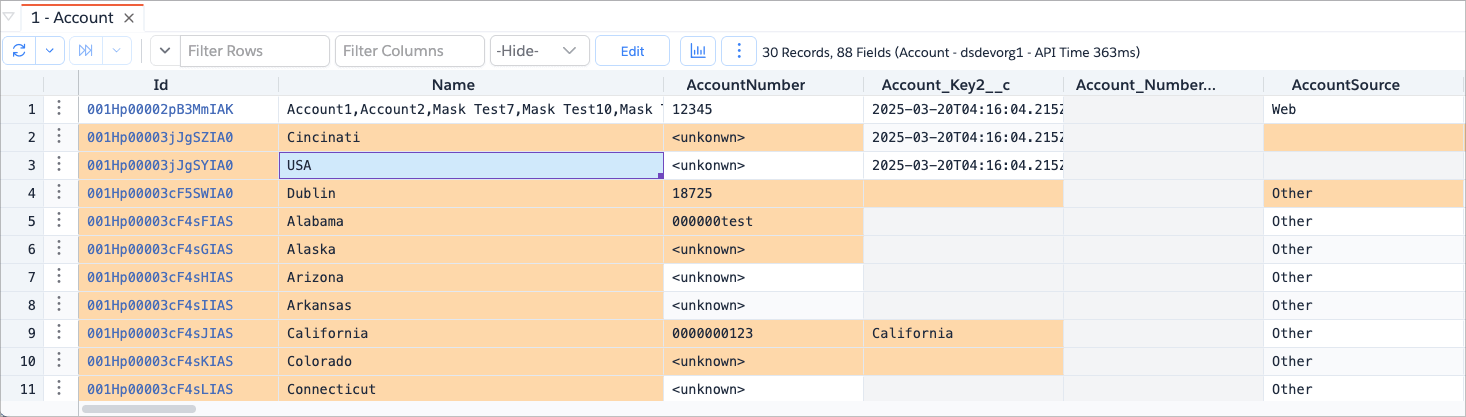
In the example below, the "Account_Number__c" column is highlighted because all rows have empty values for that field.
![]()
Cell Changes
This option highlights the cells that are different from the previous row. This is useful for quickly identifying changes in data values across rows.
In the example below, the second row "Name" column is highlighted because the value is different from the previous row. When you sort the rows, you will need to re-apply the highlighting to see the changes based on the new order.
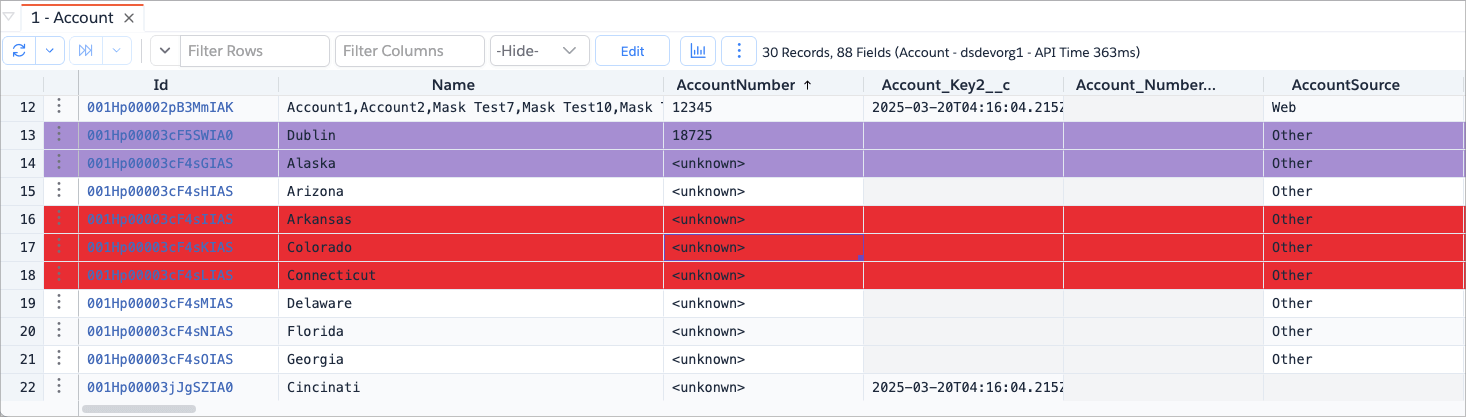
Selected Rows
The options Selected Rows and Selected Rows with Color highlight the rows that are currently selected in the
datagrid. By default, the app's default color is used, but you can choose a custom color using the color picker dialog in
the option Selected Rows with Color.
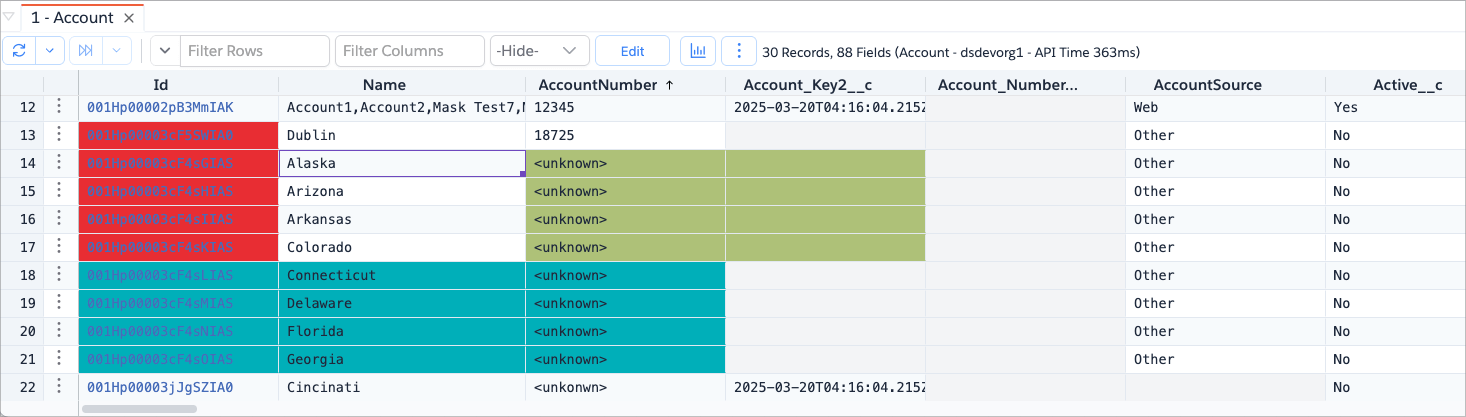
Selected Cells
The options Selected Cells and Selected Cells with Color highlight the cells that are currently selected in the
datagrid. By default, the app's default color is used, but you can choose a custom color using the color picker dialog in
the option Selected Cells with Color.
Custom Highlighting
With Custom Highlighting, you can create your own highlight rules for any columns in the datagrid. You can define the conditions using Brobench's formula engine, allowing for complex and flexible highlighting based on your data analysis needs.
To manage custom highlights, right-click on the datagrid and select Highlight -> Manage Highlights. This opens the
dialog below.

Here are the various columns in the dialog:
- Name: Descriptive name for the highlight rule
- Color: Background color for matching cells
- Order: Priority order (lower numbers execute first)
- Condition: Formula expression that determines when to apply highlighting
Adding/Editing Conditions
Click on the Plus icon to open the dialog below to add a new highlight rule. You can also edit an existing rule by
clicking on the Pencil icon next to the rule that you want to edit.

Once you add custom highlights, they appear below the built-in highlights in the right-click menu. Selecting one highlights the selected column(s).
- At this time, custom highlights cannot be used as row-level highlights. You must select one or more columns to apply the highlight.
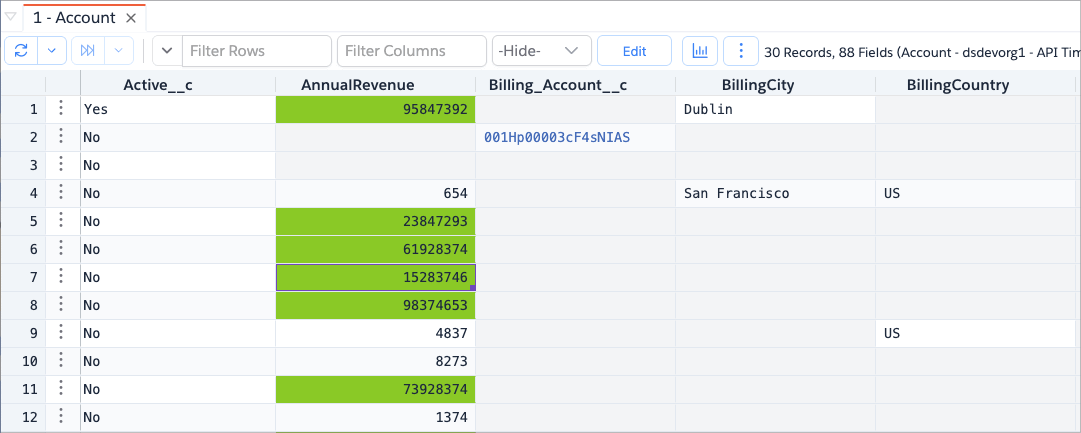
For example, in the screenshot below, the custom highlight "Revenue more than 100000" is applied to the "AnnualRevenue"
column.
Clearing Highlights
To clear the highlights, right-click on the datagrid and select Highlight -> Clear Highlights. This will remove all
highlighting.